1. Tableau, Interactive

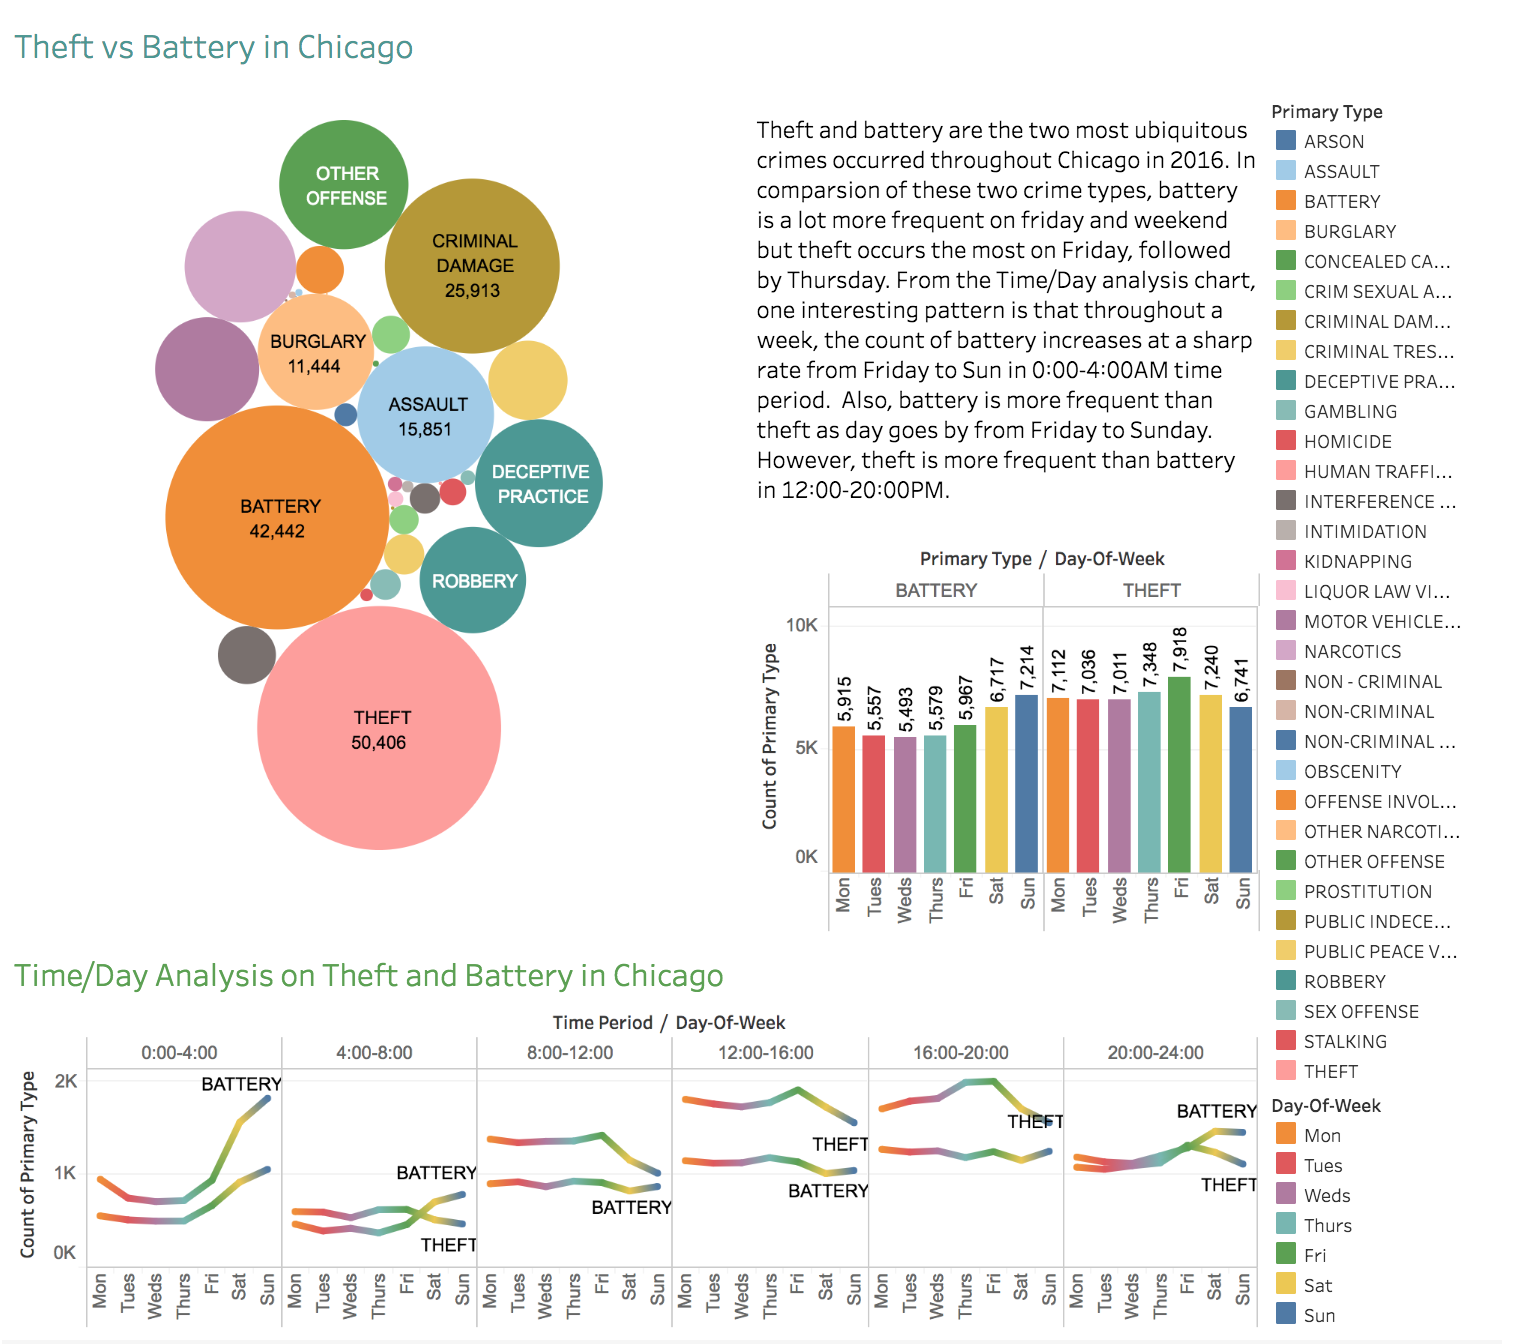
This compound visualization is created to explain the difference between the two most commonly occurring crime types in Chicago, Theft and Battery, utilizing different visualization techniques in Tableau. First, it finds a few most commonly occurring crime types in Chicago. In comparsion of these two crime types, battery is a lot more frequent on Friday and weekend but theft occurs the most on Friday, followed by Thursday. From the Time/Day analysis chart, one interesting pattern is that throughout a week, the count of battery increases at a sharp rate from Friday to Sun in 0:00-4:00AM time period. Also, battery is more frequent than theft as day goes by from Friday to Sunday. However, theft is more frequent than battery in 12:00-20:00PM.
The code and the dataset: Click Here
2. Tableau, Interactive

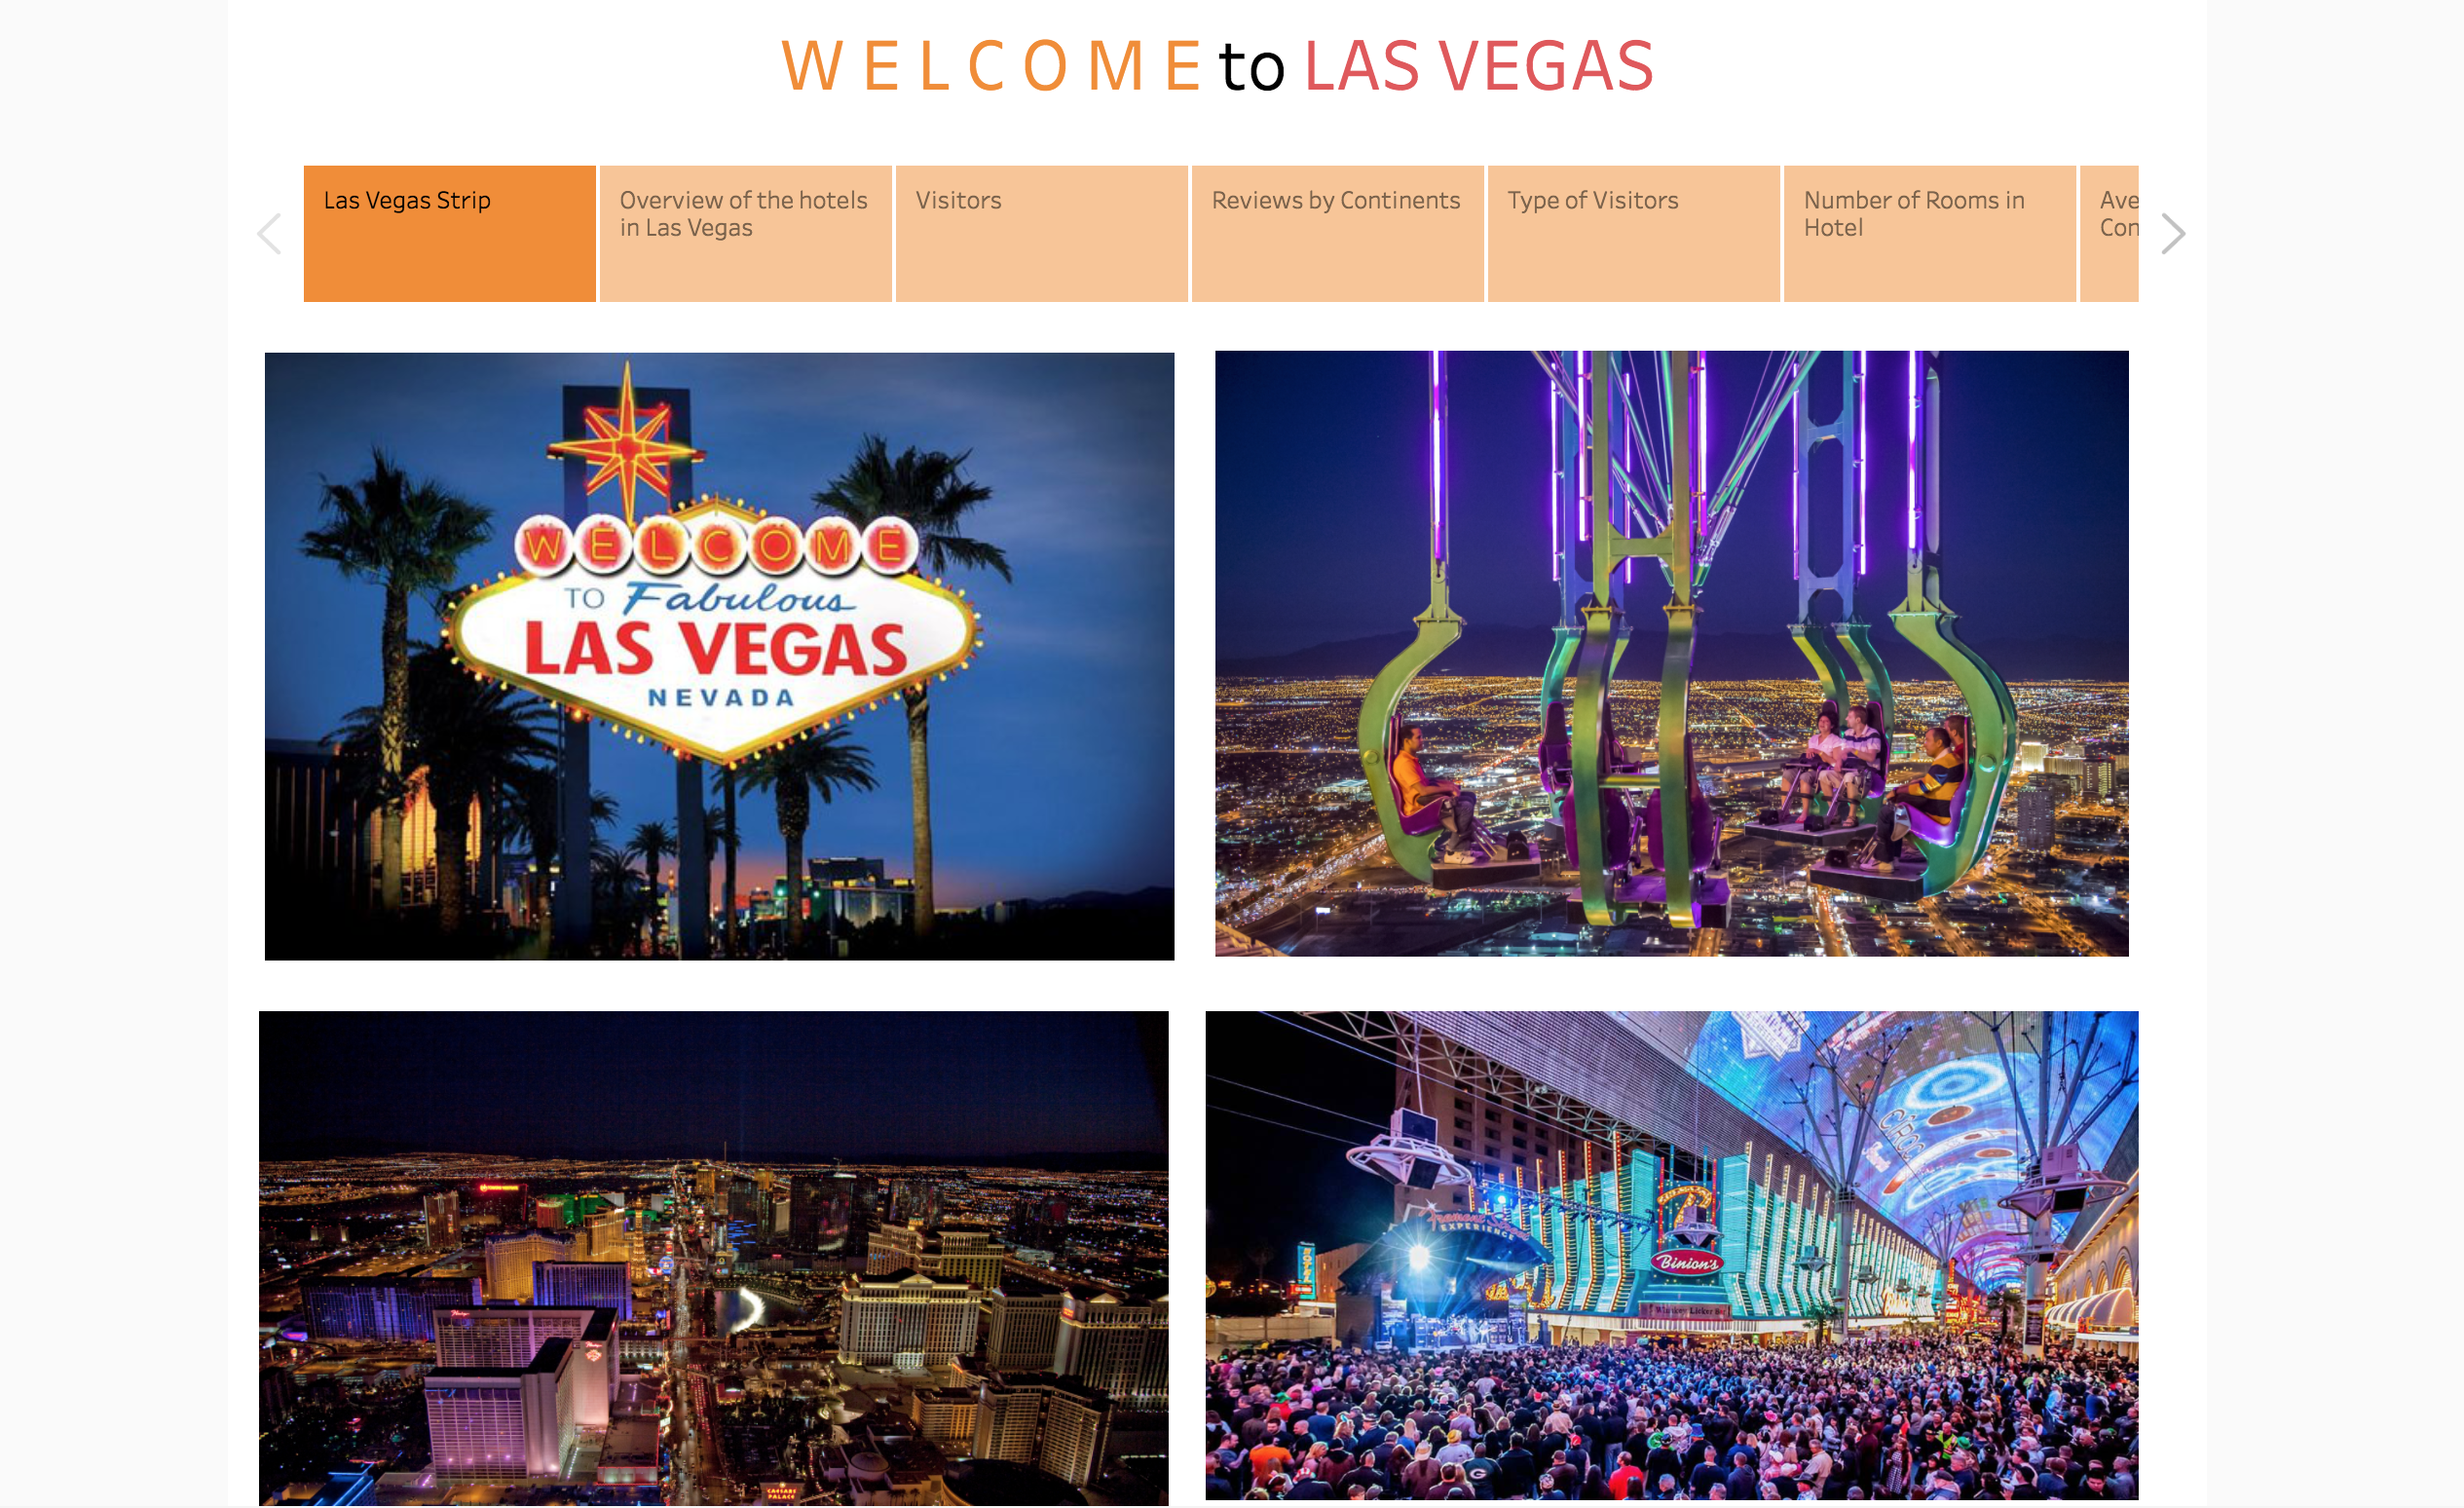
This visualization is a story of Tableau, which is a sequence of visualizations that work together to convey information. It is created to find any hidden relationship among the features and deliver as much information as possible about the Las Vegas dataset, which includes quantitative and categorical features from online reviews from 21 hotels located in Las Vegas Strip, extracted from TripAdvisor and 504 reviews were collected between January and August of 2015. From this visualization, an interesting fact observed is that Encore Wynn Las Vegas received the highest average score given by the visitors from North America.
The code and the dataset: Click Here