1. NetworkD3, Interactive

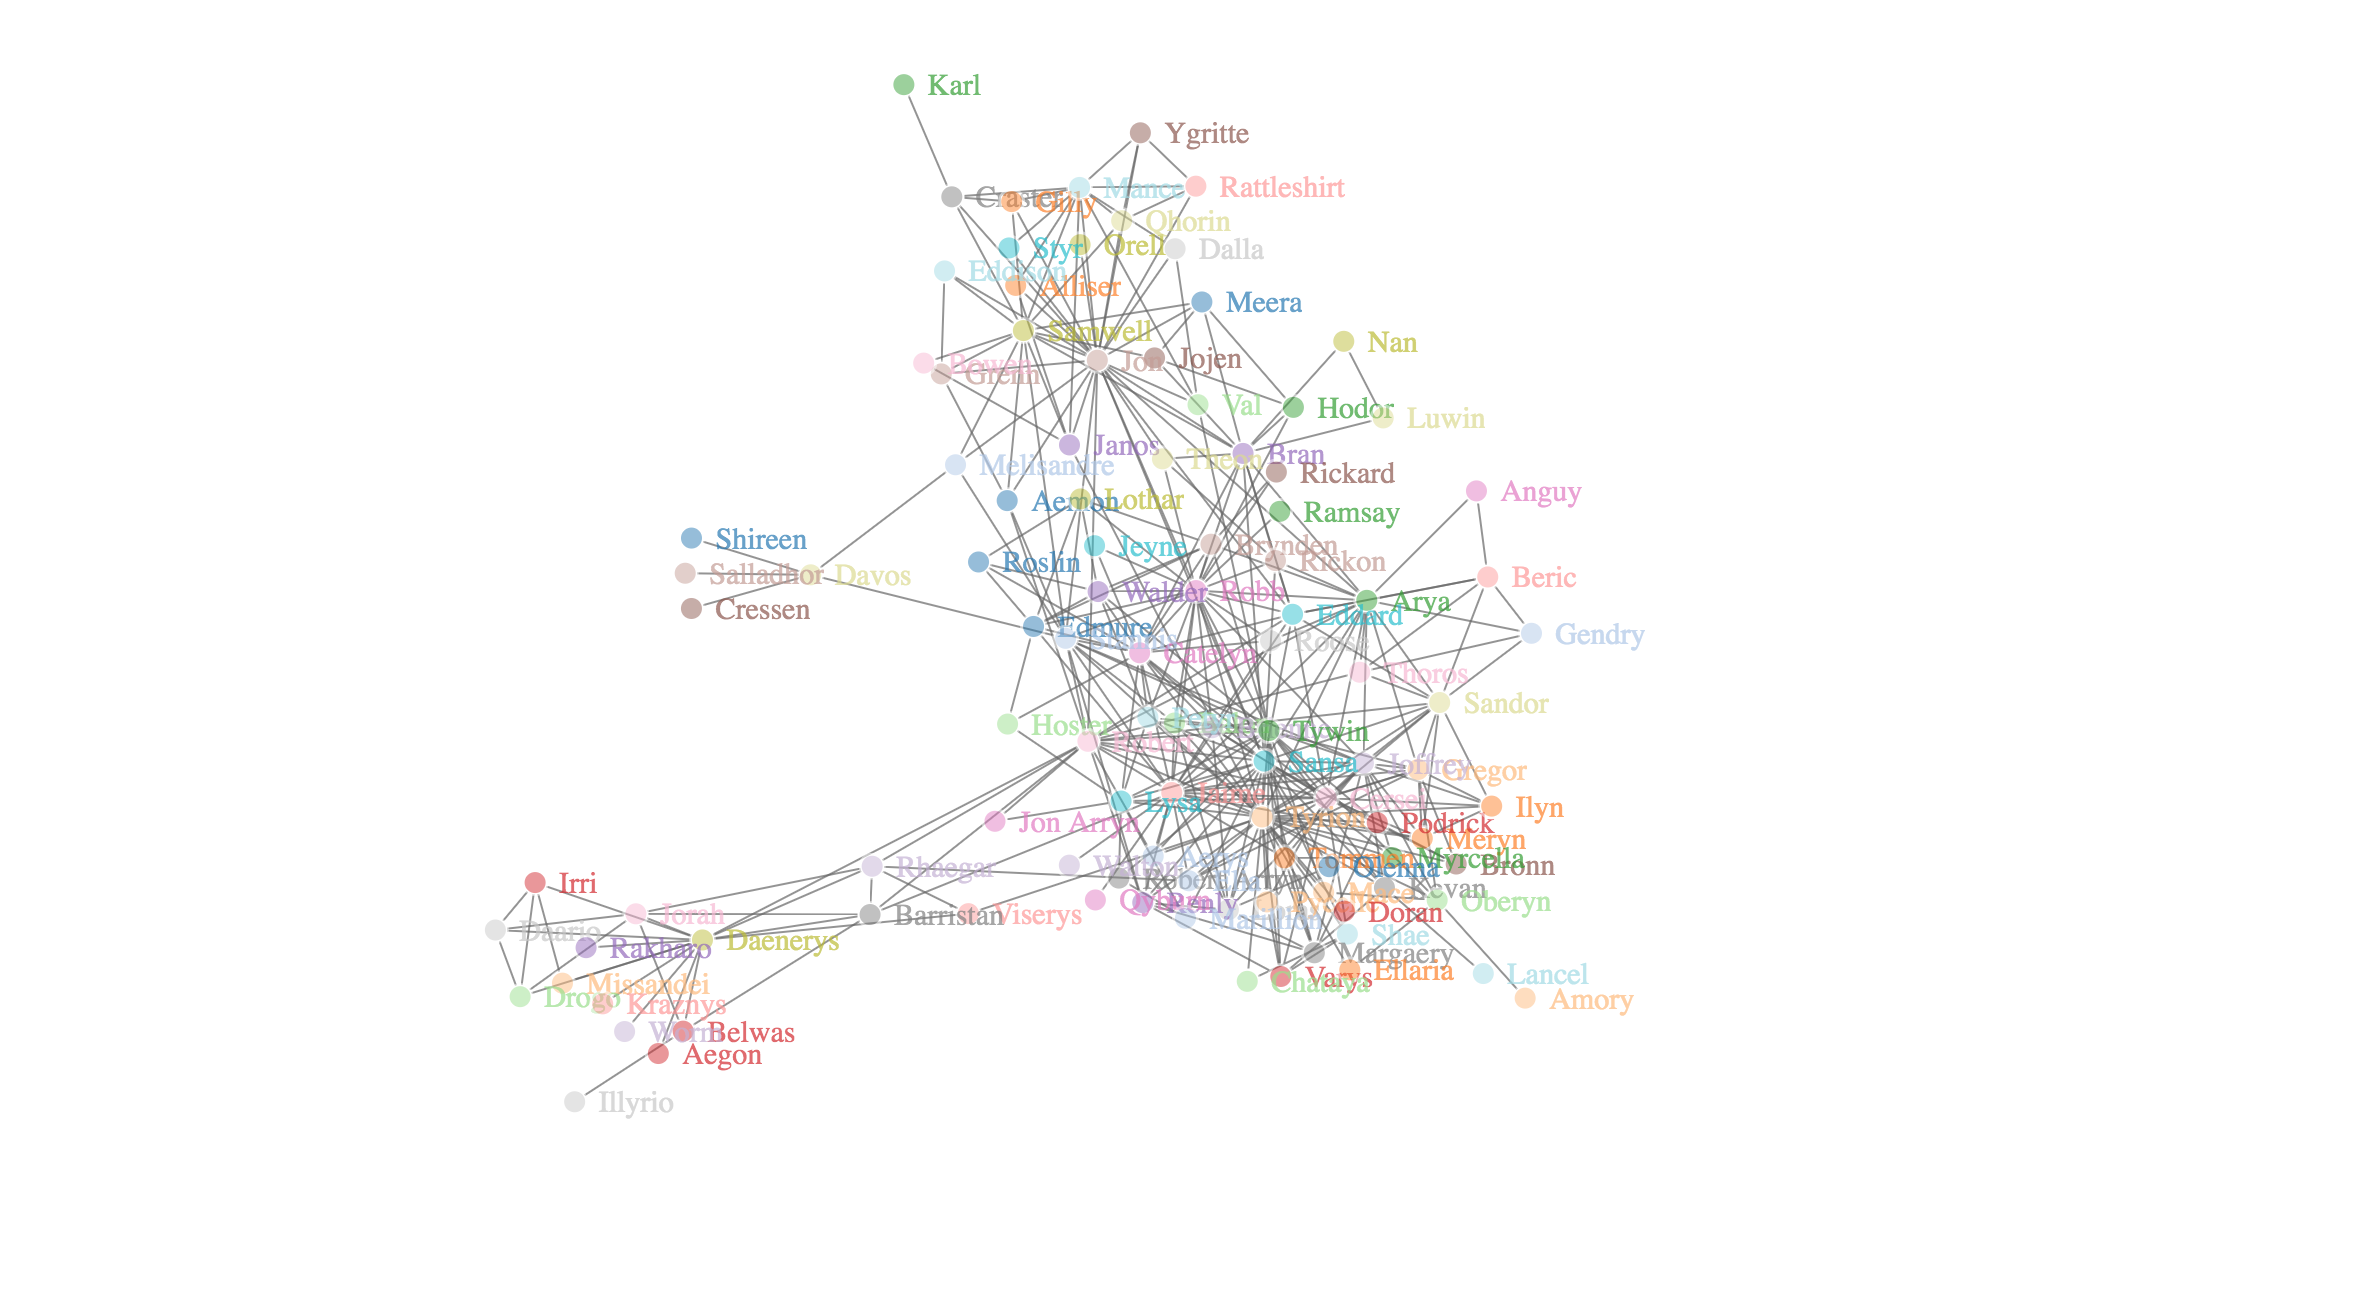
This visualization is generated using NetworkD3 in R to display the network of the characters in the novel called "A Storm of Swords" written by George R.R. Martin. In the novel, it contains 353 weighted edges connecting 107 characters. Each edge in the network represents an interaction between one character and another. The visual represents the vast network of the interactions among all the characters in the novel.
The code and the dataset: Click Here
2. Non-NetworkD3, Interactive

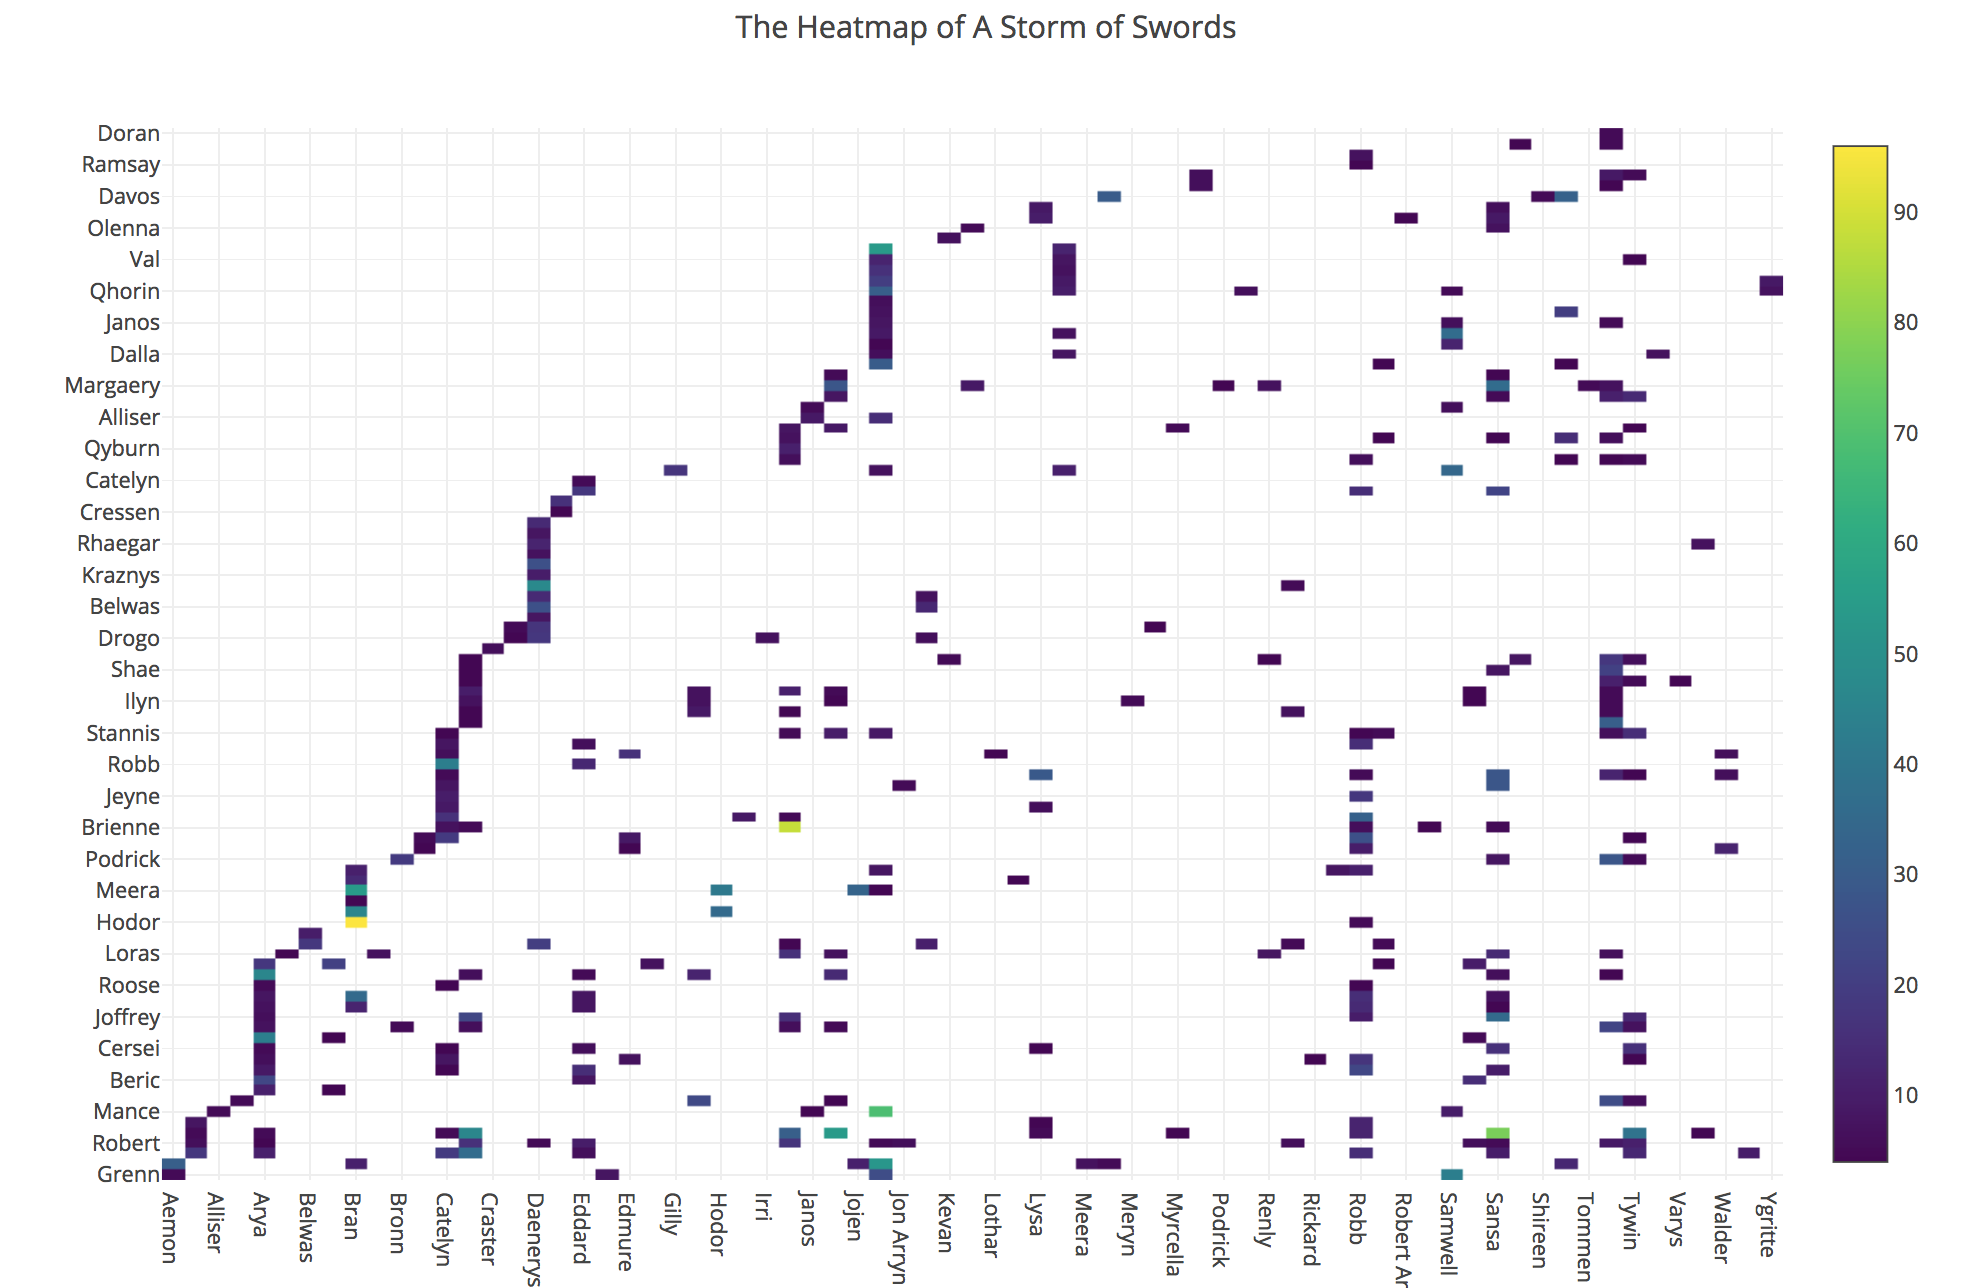
This visualization is produced using Plotly to display the network of the characters in the novel in a heatmap called "A Storm of Swords" written by George R.R. Martin. In a form of heatmap, the longer bar and the more bar are along the y-axis, the more the interaction is between the characters. Also, the color legend on the right describes the weight of an interaction between the characters. For instance, at Arya on the x-axis, the vertical bar can clearly be observed, meaning that Aray has lots of interactions among different characters in the novel. As the color intensity reaches to yellow color, the importance of the dynamics between the characters becomes more greater.
The code and the dataset: Click Here